
Research · 5 min read
A Supplier Reliability Score You Can Add to Product Research
A product can look profitable in a spreadsheet and still create operational problems once orders arrive. The supplier may take five days to process an order, quote a delivery window that stretches across two weeks, hold little stock, or require multiple units per order.
Those constraints belong in product research, not in a separate supplier check after you have selected the product. A practical way to account for them is to convert supplier data into a reliability score, then combine that score with margin and ROI.
Choose signals you can verify
A useful supplier score should rely on fields that can be compared across live listings:
- Processing time: How long the supplier takes to dispatch an order.
- Delivery range: Both the latest estimated arrival and the width of the quoted window.
- Stock depth: The inventory currently shown for the listing or variant.
- Minimum order quantity: Whether you can order one unit at a time.
- Listing age: How long the listing has remained active.
These are indicators, not guarantees. Displayed stock can change quickly. Delivery estimates do not capture every carrier delay. Listing age shows persistence, not fulfilment quality. The score helps rank alternatives; it does not eliminate the need for test orders and supplier communication.
Convert each field to a 0–100 score
Raw values cannot be added directly. Three processing days, 74 units in stock and a 240-day-old listing use different scales. Convert each one into a component score first.
A starting rubric might look like this.
| Component | Raw value | Score | |---|---:|---:| | Processing time | 0–2 days | 100 | | | 3 days | 80 | | | 4–5 days | 55 | | | 6–7 days | 25 | | | More than 7 days | 0 | | Stock depth | 100+ units | 100 | | | 50–99 units | 75 | | | 20–49 units | 50 | | | 1–19 units | 20 | | | Out of stock | 0 | | Order minimum | 1 unit | 100 | | | 2–3 units | 60 | | | 4–5 units | 30 | | | More than 5 units | 0 | | Listing age | 180+ days | 100 | | | 90–179 days | 75 | | | 30–89 days | 50 | | | 7–29 days | 25 | | | Less than 7 days | 10 |
Delivery needs slightly different treatment because a range such as 6–10 days contains two pieces of information.
First, score the latest estimated day:
- 7 days or less: 100
- 8–10 days: 80
- 11–14 days: 55
- 15–21 days: 25
- More than 21 days: 0
Then subtract 5 points if the range is wider than seven days, or 15 points if it is wider than 14 days. Do not allow the result to fall below zero.
This distinguishes a focused 8–10-day estimate from a less predictable 8–20-day estimate.
Weight the factors by operational impact
Not every field deserves equal weight. Delivery and processing usually have a more direct customer impact than listing age, so they should carry more of the score.
One possible formula is:
Reliability = (Processing × 0.25) + (Delivery × 0.35) + (Stock × 0.20) + (MOQ × 0.10) + (Listing age × 0.10)
The result is a score out of 100.
Keep listing age lightly weighted. An old listing may be more established, but it could also contain outdated descriptions, images or variants. Stock should also be interpreted in context: 50 units may be adequate for early testing but insufficient for a product already receiving substantial daily order volume.
Your own operating model should determine the thresholds. A seller targeting domestic delivery may reject estimates that another seller serving a harder-to-reach market would accept.
Worked example
Consider a hypothetical supplier listing with these values:
- Processing time: 3 days
- Delivery estimate: 6–10 days
- Available stock: 74 units
- Minimum order: 1 unit
- Listing age: 240 days
Using the rubric above:
- Processing score: 80
- Delivery score: 80
- Stock score: 75
- MOQ score: 100
- Listing-age score: 100
The calculation is:
(80 × 0.25) + (80 × 0.35) + (75 × 0.20) + (100 × 0.10) + (100 × 0.10) = 83
The listing receives a supplier reliability score of 83/100.
That number is only useful when placed beside the economics. Suppose the same product has:
- Selling price: $39
- Product cost: $16
- Shipping cost: $4
- Estimated payment costs: $1.17
- Advertising allowance: $9
- Returns and support allowance: $2
Estimated contribution per order is:
$39 - $16 - $4 - $1.17 - $9 - $2 = $6.83
That equals a contribution margin of approximately 17.5% and a return of approximately 34.2% on the $20 product-and-shipping cost. These figures depend entirely on the assumptions entered. Sellers can check their own numbers with the Drop-IQ profit calculator.
Combine reliability with product economics
A high-reliability supplier cannot rescue a product with inadequate margin. Likewise, strong theoretical margin may not justify a supplier with long processing times and unstable stock.
Create a separate economics score using the factors that matter to your store, such as:
- Contribution margin
- ROI on product and shipping cost
- Absolute profit per order
- Selling-price ceiling
- Advertising allowance
- Expected refund or return cost
You can then combine the two categories. For example:
Final score = (Economics score × 0.60) + (Supplier reliability × 0.40)
If the worked product receives an economics score of 72, its combined score is:
(72 × 0.60) + (83 × 0.40) = 76.4
Now compare it with a second listing that has an economics score of 84 but a reliability score of 48:
(84 × 0.60) + (48 × 0.40) = 69.6
The second listing looks better on margin alone, but ranks lower after supplier conditions are included. This does not make it automatically unsuitable; it exposes the trade-off for review.
Add hard rejection rules
Weighted averages can hide unacceptable conditions. A very high margin could compensate mathematically for a delivery estimate you would never show customers.
Add explicit rules such as:
- Exclude if processing time exceeds seven days.
- Exclude if the latest delivery estimate exceeds 21 days.
- Exclude if stock is zero.
- Exclude if the minimum order is above one for products shipped directly to individual customers.
- Cap the final score if required supplier data is missing.
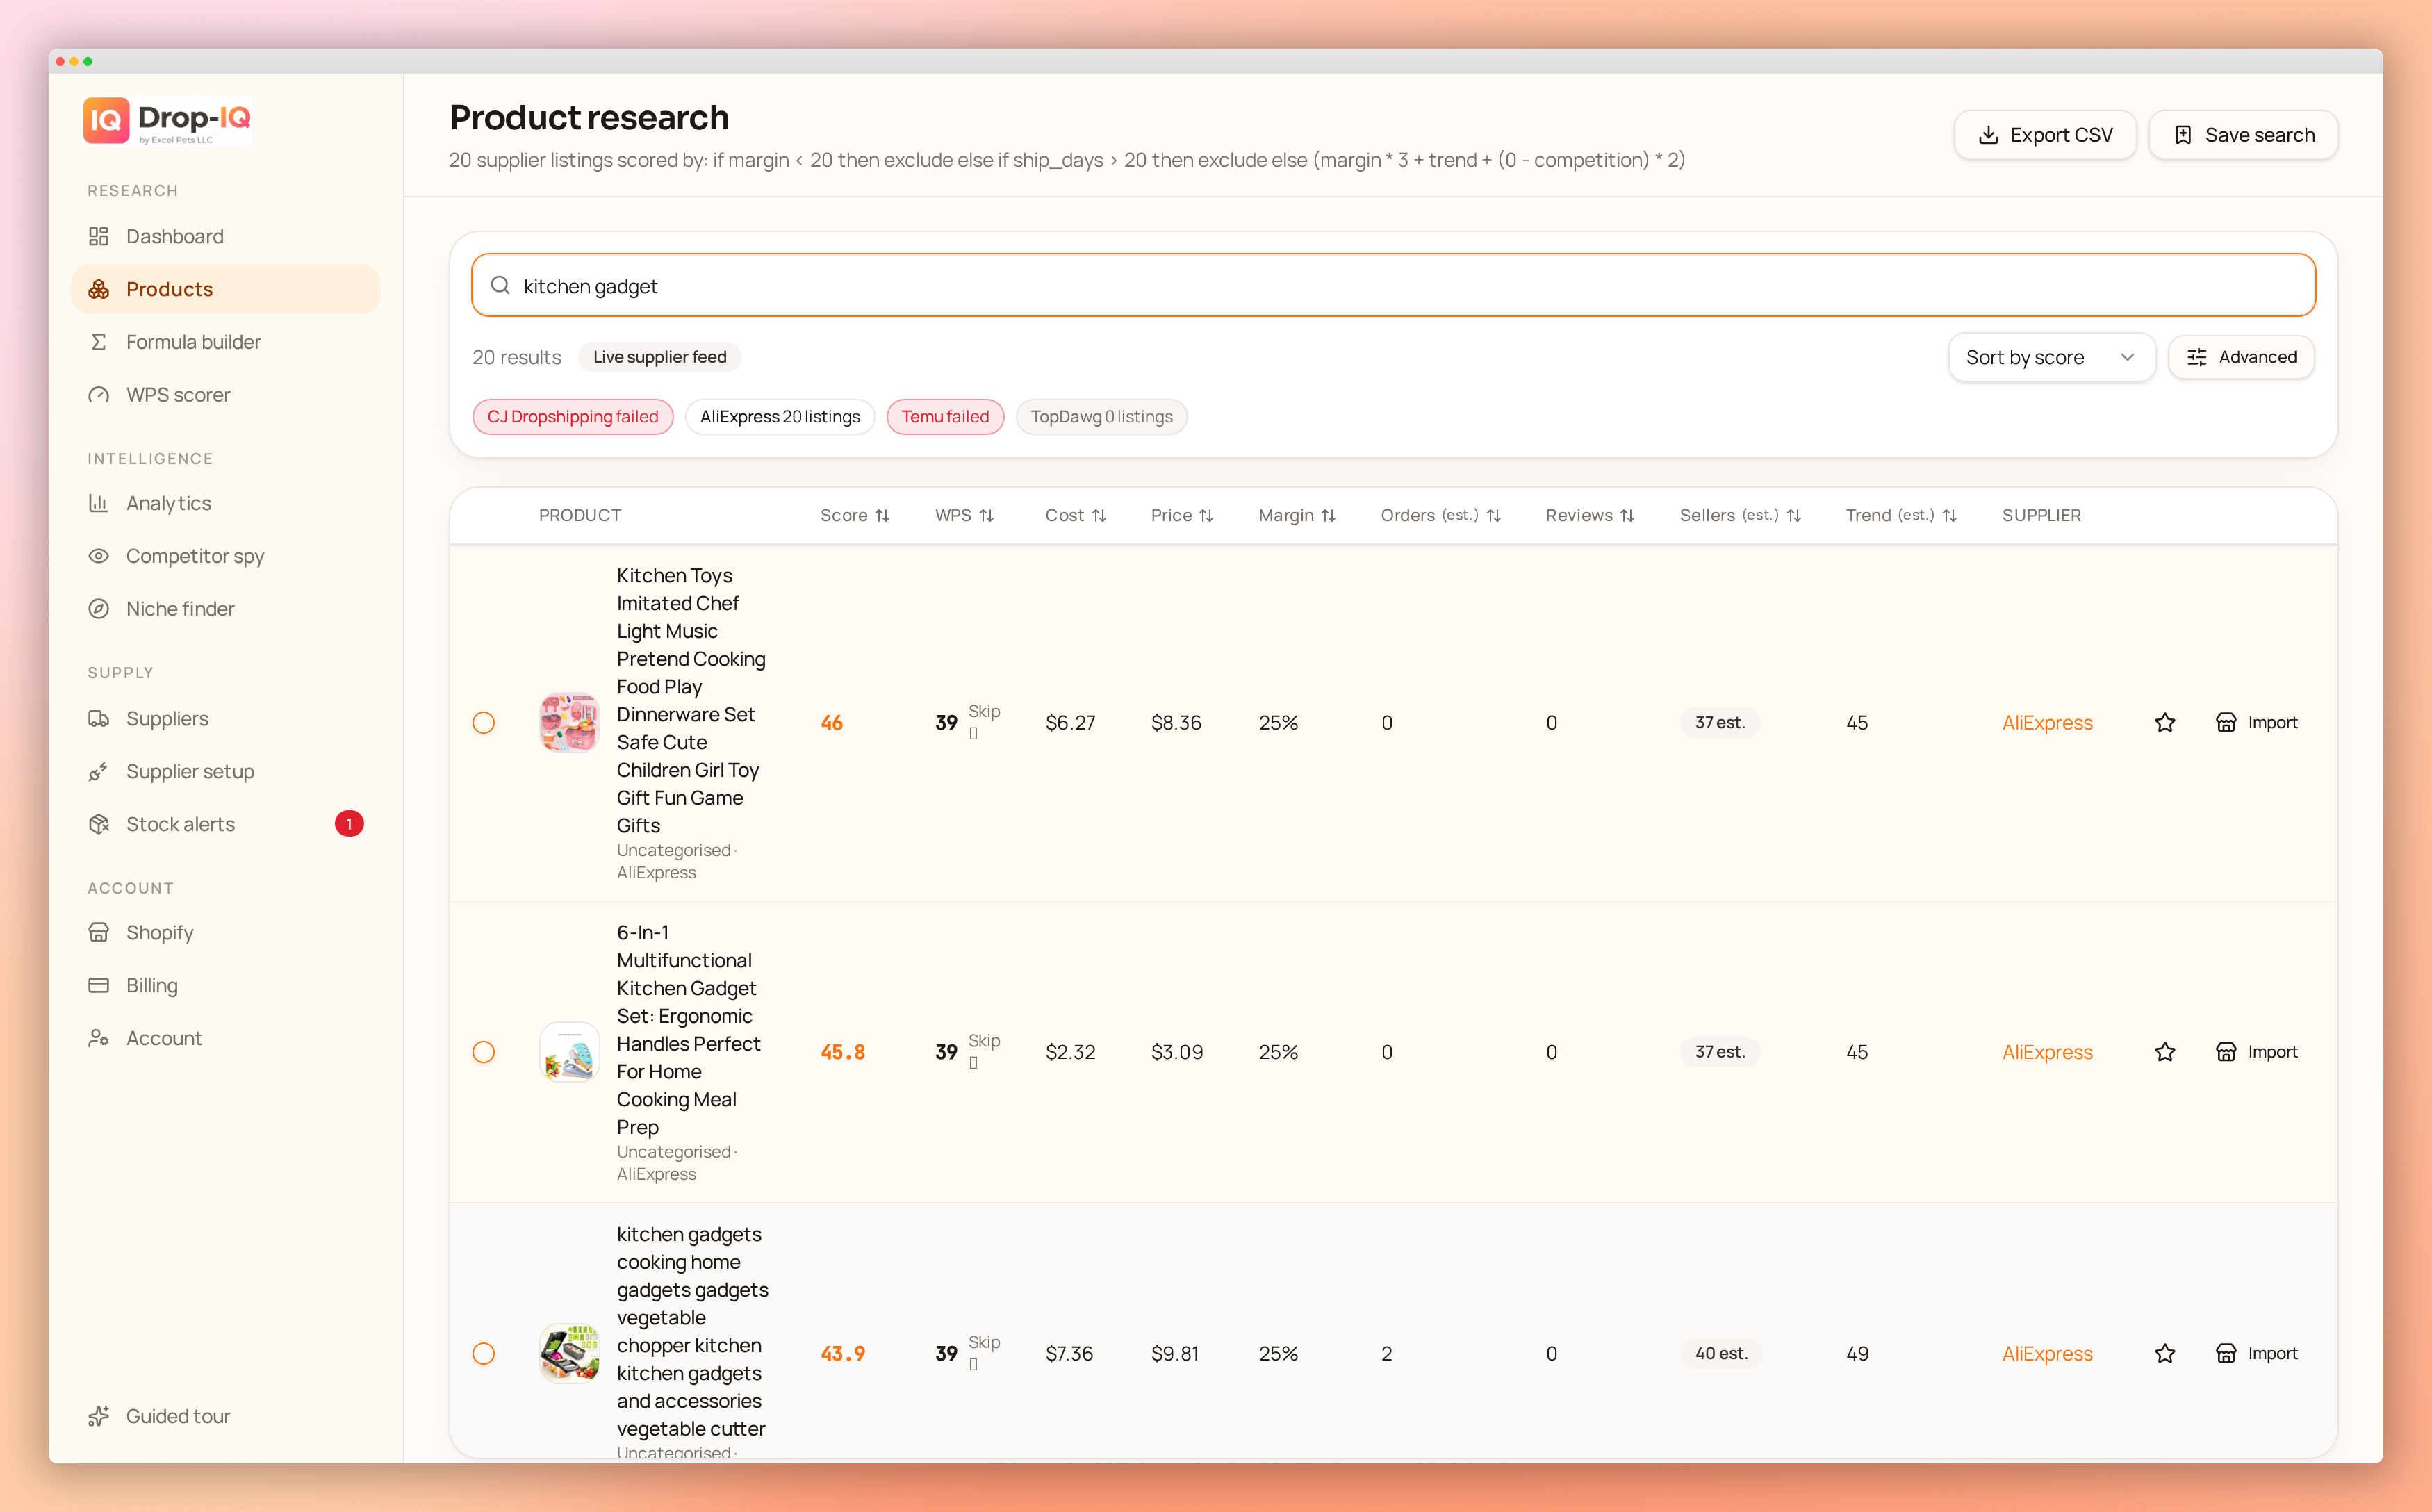
In Drop-IQ, seller-written formulas and if/then rules can be used to rank live supplier listings according to these priorities rather than relying on a generic definition of a winning product. Deeper comparison becomes useful when several suppliers carry similar products but differ materially on fulfilment terms.
The honest next step is to score five products you are already considering, verify the economics in the calculator, and test whether the ranking matches the supplier trade-offs you would actually accept.