
Research · 6 min read
Add the Costs That Usually Get Left Out of Product Research
A product can look profitable in a research spreadsheet and still lose money once it reaches a real Shopify order. The usual cause is not bad arithmetic. It is missing arithmetic.
Supplier price and retail price are only the beginning. Shipping, payment processing, discounts, returns, and customer acquisition all claim part of the same contribution margin. If those costs are added only after a product is shortlisted—or after ads start running—the ranking was based on an incomplete comparison.
A landed-cost worksheet fixes that problem. It gives every candidate product the same cost treatment before you compare margin, ROI, trend, stock, or shipping time.
Start with the price customers actually pay
Do not calculate profit from the product’s full list price unless you expect most customers to pay it.
If a product is listed at $49 but is commonly sold with a 10% welcome code, the expected selling price is closer to $44.10. Free-shipping thresholds, bundles, automatic discounts, and abandoned-cart offers can reduce it further.
Use a realistic average discount rather than the most generous discount available:
Expected selling price = List price × (1 - expected discount rate)
For a $49 product with an expected discount rate of 10%:
$49 × (1 - 0.10) = $44.10
If you have historical order data, use the average discount for comparable products or traffic sources. If you do not, build multiple scenarios instead of assuming zero discount.
Sales tax should generally not be treated as revenue when it is collected for remittance. Keep the worksheet focused on the amount that belongs to the business.
Record supplier price and shipping separately
Supplier listings often make the item price prominent while varying shipping by destination, method, quantity, or warehouse.
Your worksheet should therefore include separate fields for:
- Supplier unit price
- Shipping charge to the target country
- Any per-order handling fee
- Optional shipping upgrades
- Currency conversion buffer, if supplier costs are not in your store currency
Do not use the cheapest shipping method automatically. Use the method you would actually offer based on delivery time and tracking quality.
Keeping product cost and shipping separate also makes supplier comparisons clearer. A $9 item with $8 shipping is not cheaper than a $12 item with $3 shipping, even though its displayed unit price is lower.
A basic delivered supplier cost is:
Delivered supplier cost = Supplier price + Supplier shipping + Handling
This is sometimes called landed cost, although traditional landed-cost calculations may also include duties, tariffs, brokerage, and import taxes. Add those where they apply to your fulfilment model and destination.
Calculate payment fees from the discounted price
Payment processing is easy to overlook because it is deducted after the transaction. It is also usually composed of both a percentage and a fixed fee.
Use the actual fee structure for the payment method and Shopify plan being modelled. A general formula is:
Payment fee = Expected selling price × percentage fee + fixed fee
For example, if the expected selling price is $44.10 and the assumed processing fee is 2.9% plus $0.30:
$44.10 × 0.029 + $0.30 = $1.58
Round only at the end of the calculation. Repeated rounding across hundreds of orders can make forecasts less useful.
If your store incurs additional transaction fees for certain payment setups, include those as a separate line. The worksheet should reflect your checkout economics, not a generic industry assumption.
Convert returns into a per-order allowance
Returns are uncertain at the individual-order level but still need a place in product research.
A returns allowance spreads the expected cost across all orders:
Returns allowance per order = Expected return rate × Average net cost per return
The net cost of a return may include:
- Supplier cost that cannot be recovered
- Original shipping that is not recoverable
- Refund processing costs
- Return postage paid by the seller
- Replacement shipment costs
- Payment fees that are not refunded
- Salvage value for an item that can be resold
Avoid treating the full refund as an additional cost if you have already removed the refunded revenue elsewhere. That double-counts the same event. Model the economic loss: the costs retained after the sale is reversed, plus any extra return-related expense.
If you have no relevant history, calculate a low, base, and high scenario. Products with sizing, fragility, compatibility requirements, or subjective quality expectations may need a wider range than simple, non-sized items.
Treat target CPA as a cost, not leftover margin
Customer acquisition cost should be included before ranking products. Otherwise, low-ticket products often look stronger than they are because the worksheet assigns all pre-ad contribution margin to “profit.”
Target CPA is the maximum acquisition cost your model allows while preserving the desired profit per order.
You can either enter a target CPA directly or derive it:
Maximum CPA = Expected selling price - non-ad costs - target profit
This makes the trade-off explicit. A product with $20 of pre-ad contribution margin does not have a $20 viable CPA if you also want $8 of profit per order. Its maximum CPA is $12.
For organic traffic, CPA may be zero for a specific order, but content, apps, creative production, and labour are not necessarily free. Keep paid acquisition separate from overhead so the worksheet remains useful, then test both paid and organic scenarios where appropriate.
Worked example: from attractive markup to usable margin
Consider a product with these assumptions:
| Item | Amount | |---|---:| | List price | $49.00 | | Expected discount | 10% | | Expected selling price | $44.10 | | Supplier price | $12.00 | | Supplier shipping | $5.50 | | Payment fee | $1.58 | | Returns allowance | $2.00 | | Target CPA | $14.00 |
The contribution profit per order is:
$44.10 - $12.00 - $5.50 - $1.58 - $2.00 - $14.00 = $9.02
Contribution margin is:
$9.02 ÷ $44.10 = 20.5%
At first glance, the product appeared to have $37 of markup between its $12 supplier price and $49 list price. After realistic discounts and variable costs, it contributes $9.02 before store-wide overhead, software, support labour, chargebacks, and taxes.
Now test a less favourable scenario. If shipping rises to $7.50 and CPA reaches $18, contribution profit falls to:
$44.10 - $12.00 - $7.50 - $1.58 - $2.00 - $18.00 = $3.02
The product is still positive on this worksheet, but there is far less room for operational costs or forecasting error.
Rank products only after normalising the inputs
Use the same columns and assumptions for every candidate:
- List price
- Expected discount rate
- Expected selling price
- Supplier price
- Shipping and handling
- Payment fees
- Duties or other per-order charges
- Returns allowance
- Target CPA
- Contribution profit and margin
Then add non-cost signals such as trend, delivery time, stock availability, supplier reliability, and product fit.
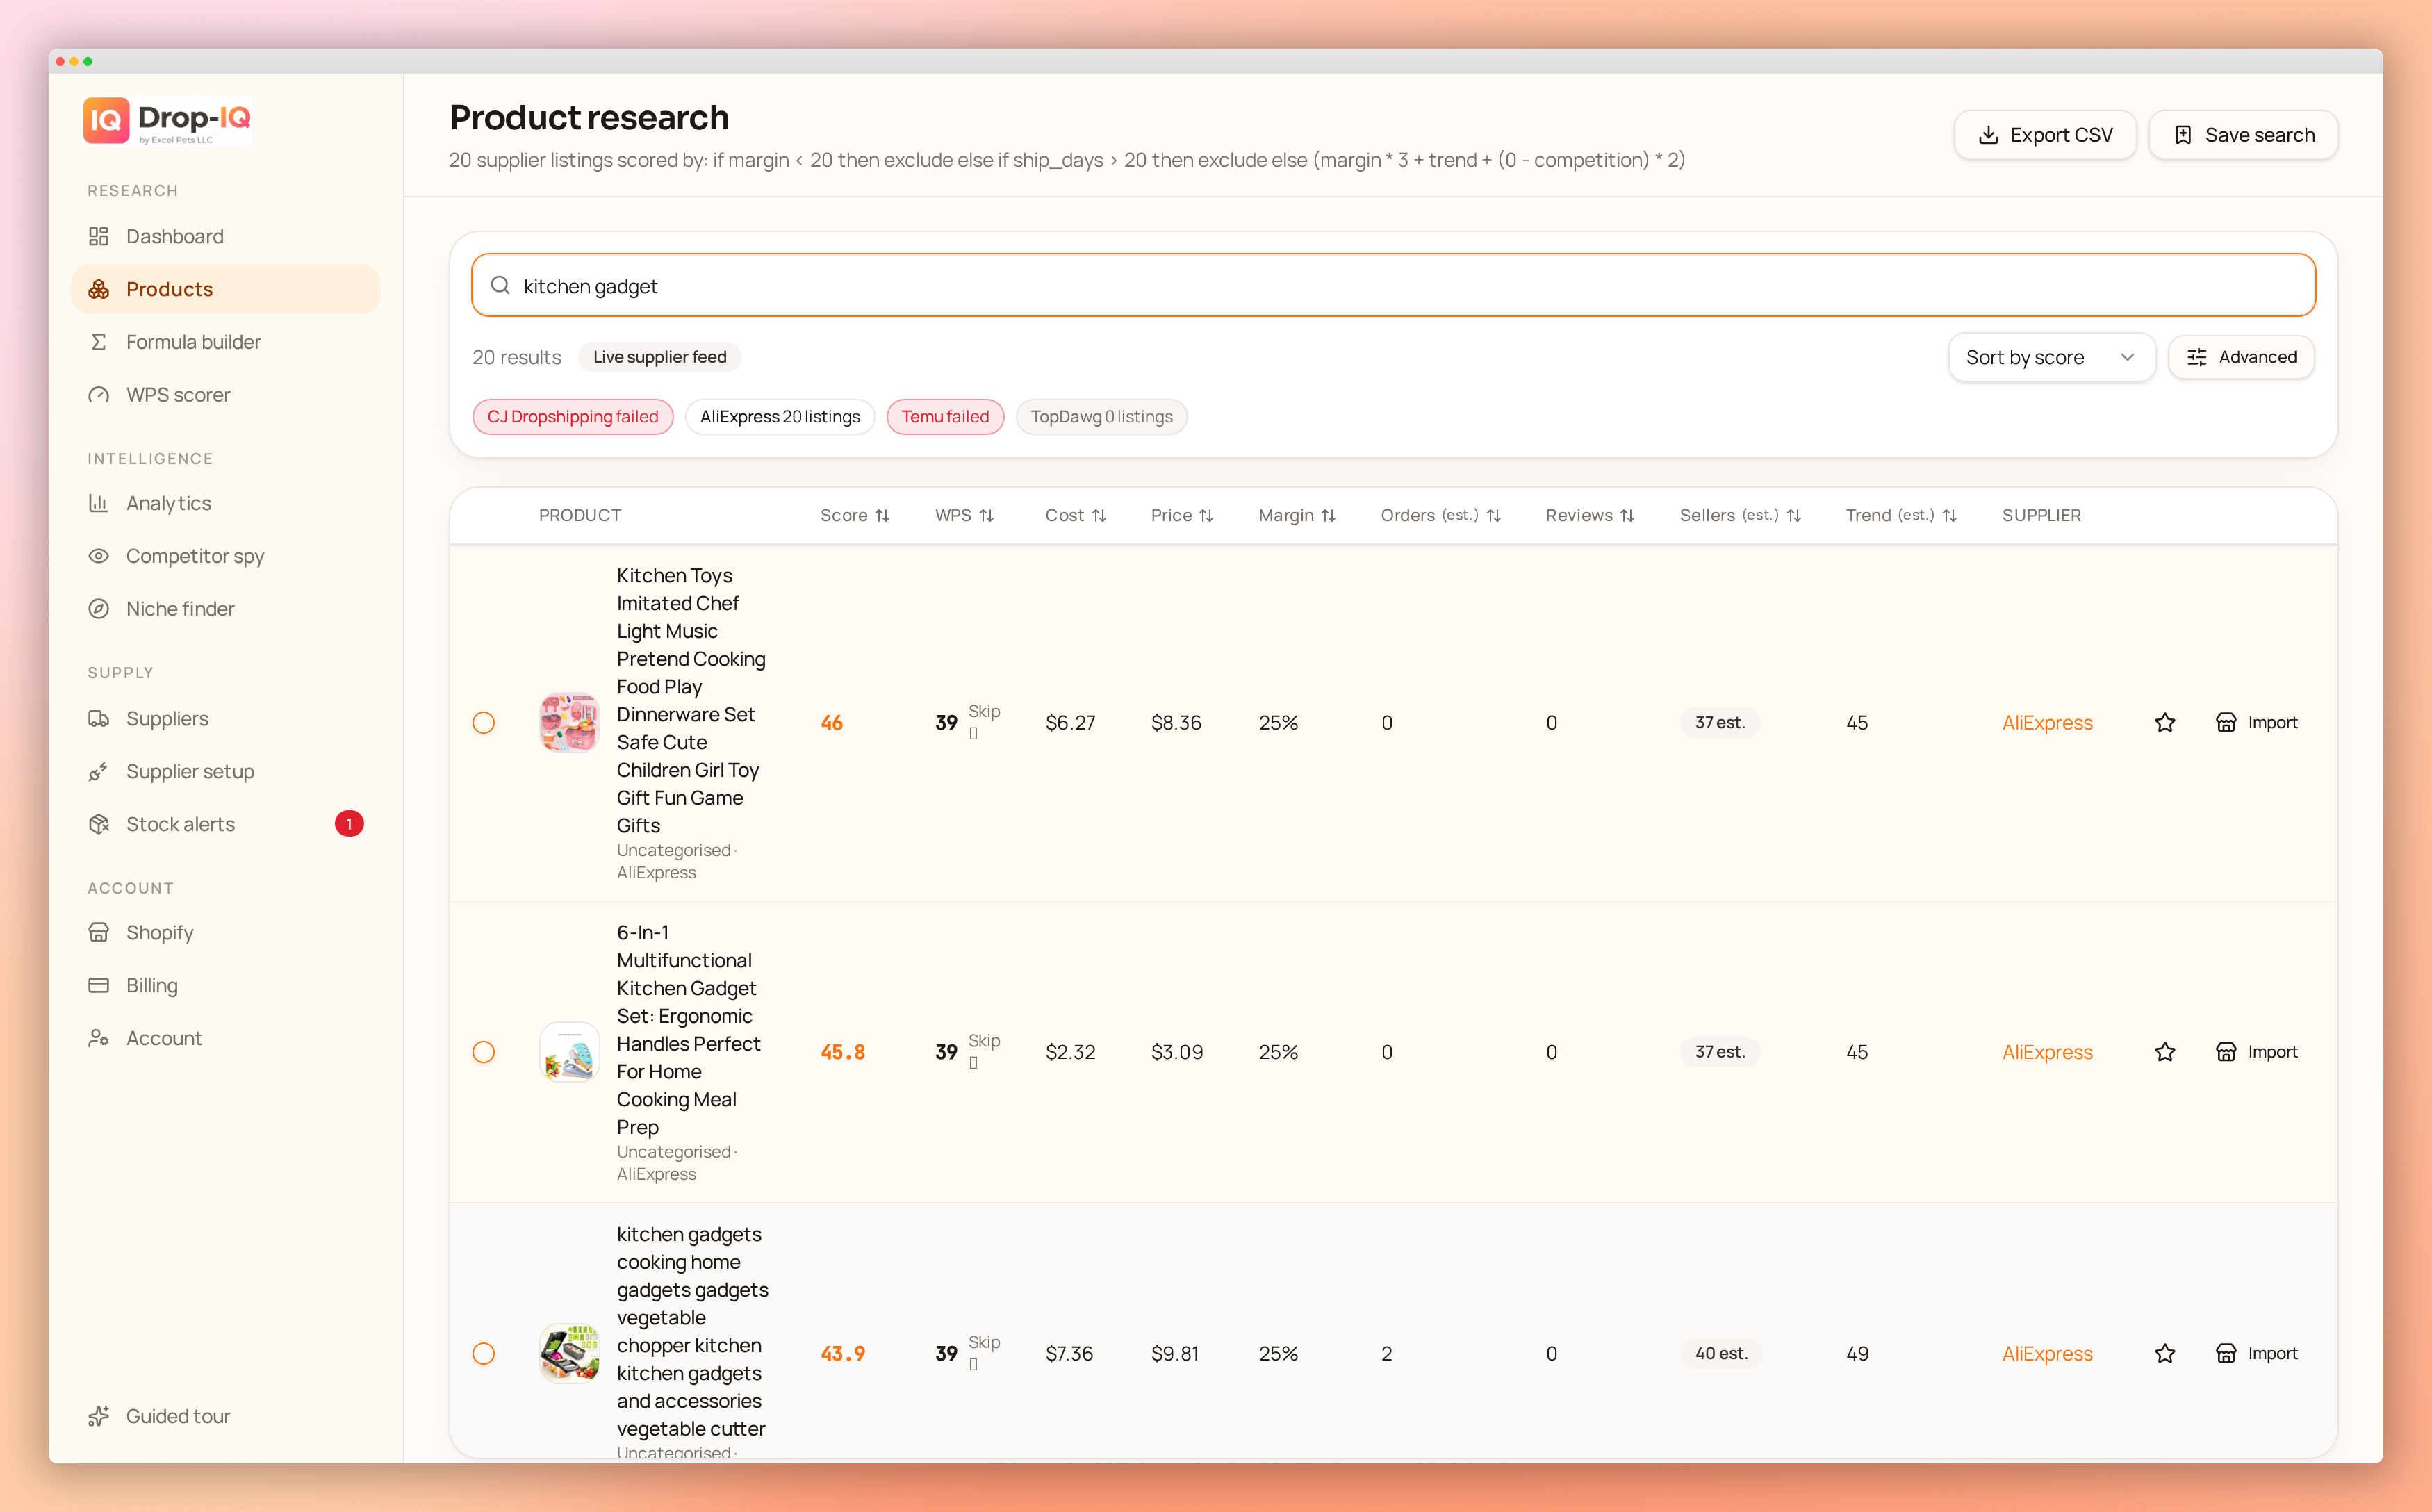
In Drop-IQ, this cost model can inform a custom winning-product formula rather than relying on headline margin alone. For example: score = margin_pct * 0.4 + roi * 0.25 + trend * 0.2 + shipping_score * 0.15, with an if/then rule that excludes products when contribution profit is below your minimum. The exact weights should reflect your store’s constraints.
Check the shortlist under more than one scenario
A single forecast hides sensitivity. At minimum, run:
- Base case: your most likely assumptions
- Downside case: higher shipping, CPA, or returns
- Improved case: better supplier terms or conversion efficiency
You can verify shortlisted products with the free Drop-IQ profit calculator. Use it to check the arithmetic, then keep the worksheet as the consistent source of assumptions across products.
The honest next step is to take your current top five candidates, add every cost line above, and rerank them using the base and downside cases.