
Research · 5 min read
Calculate Contribution Margin Before You Compare ROAS
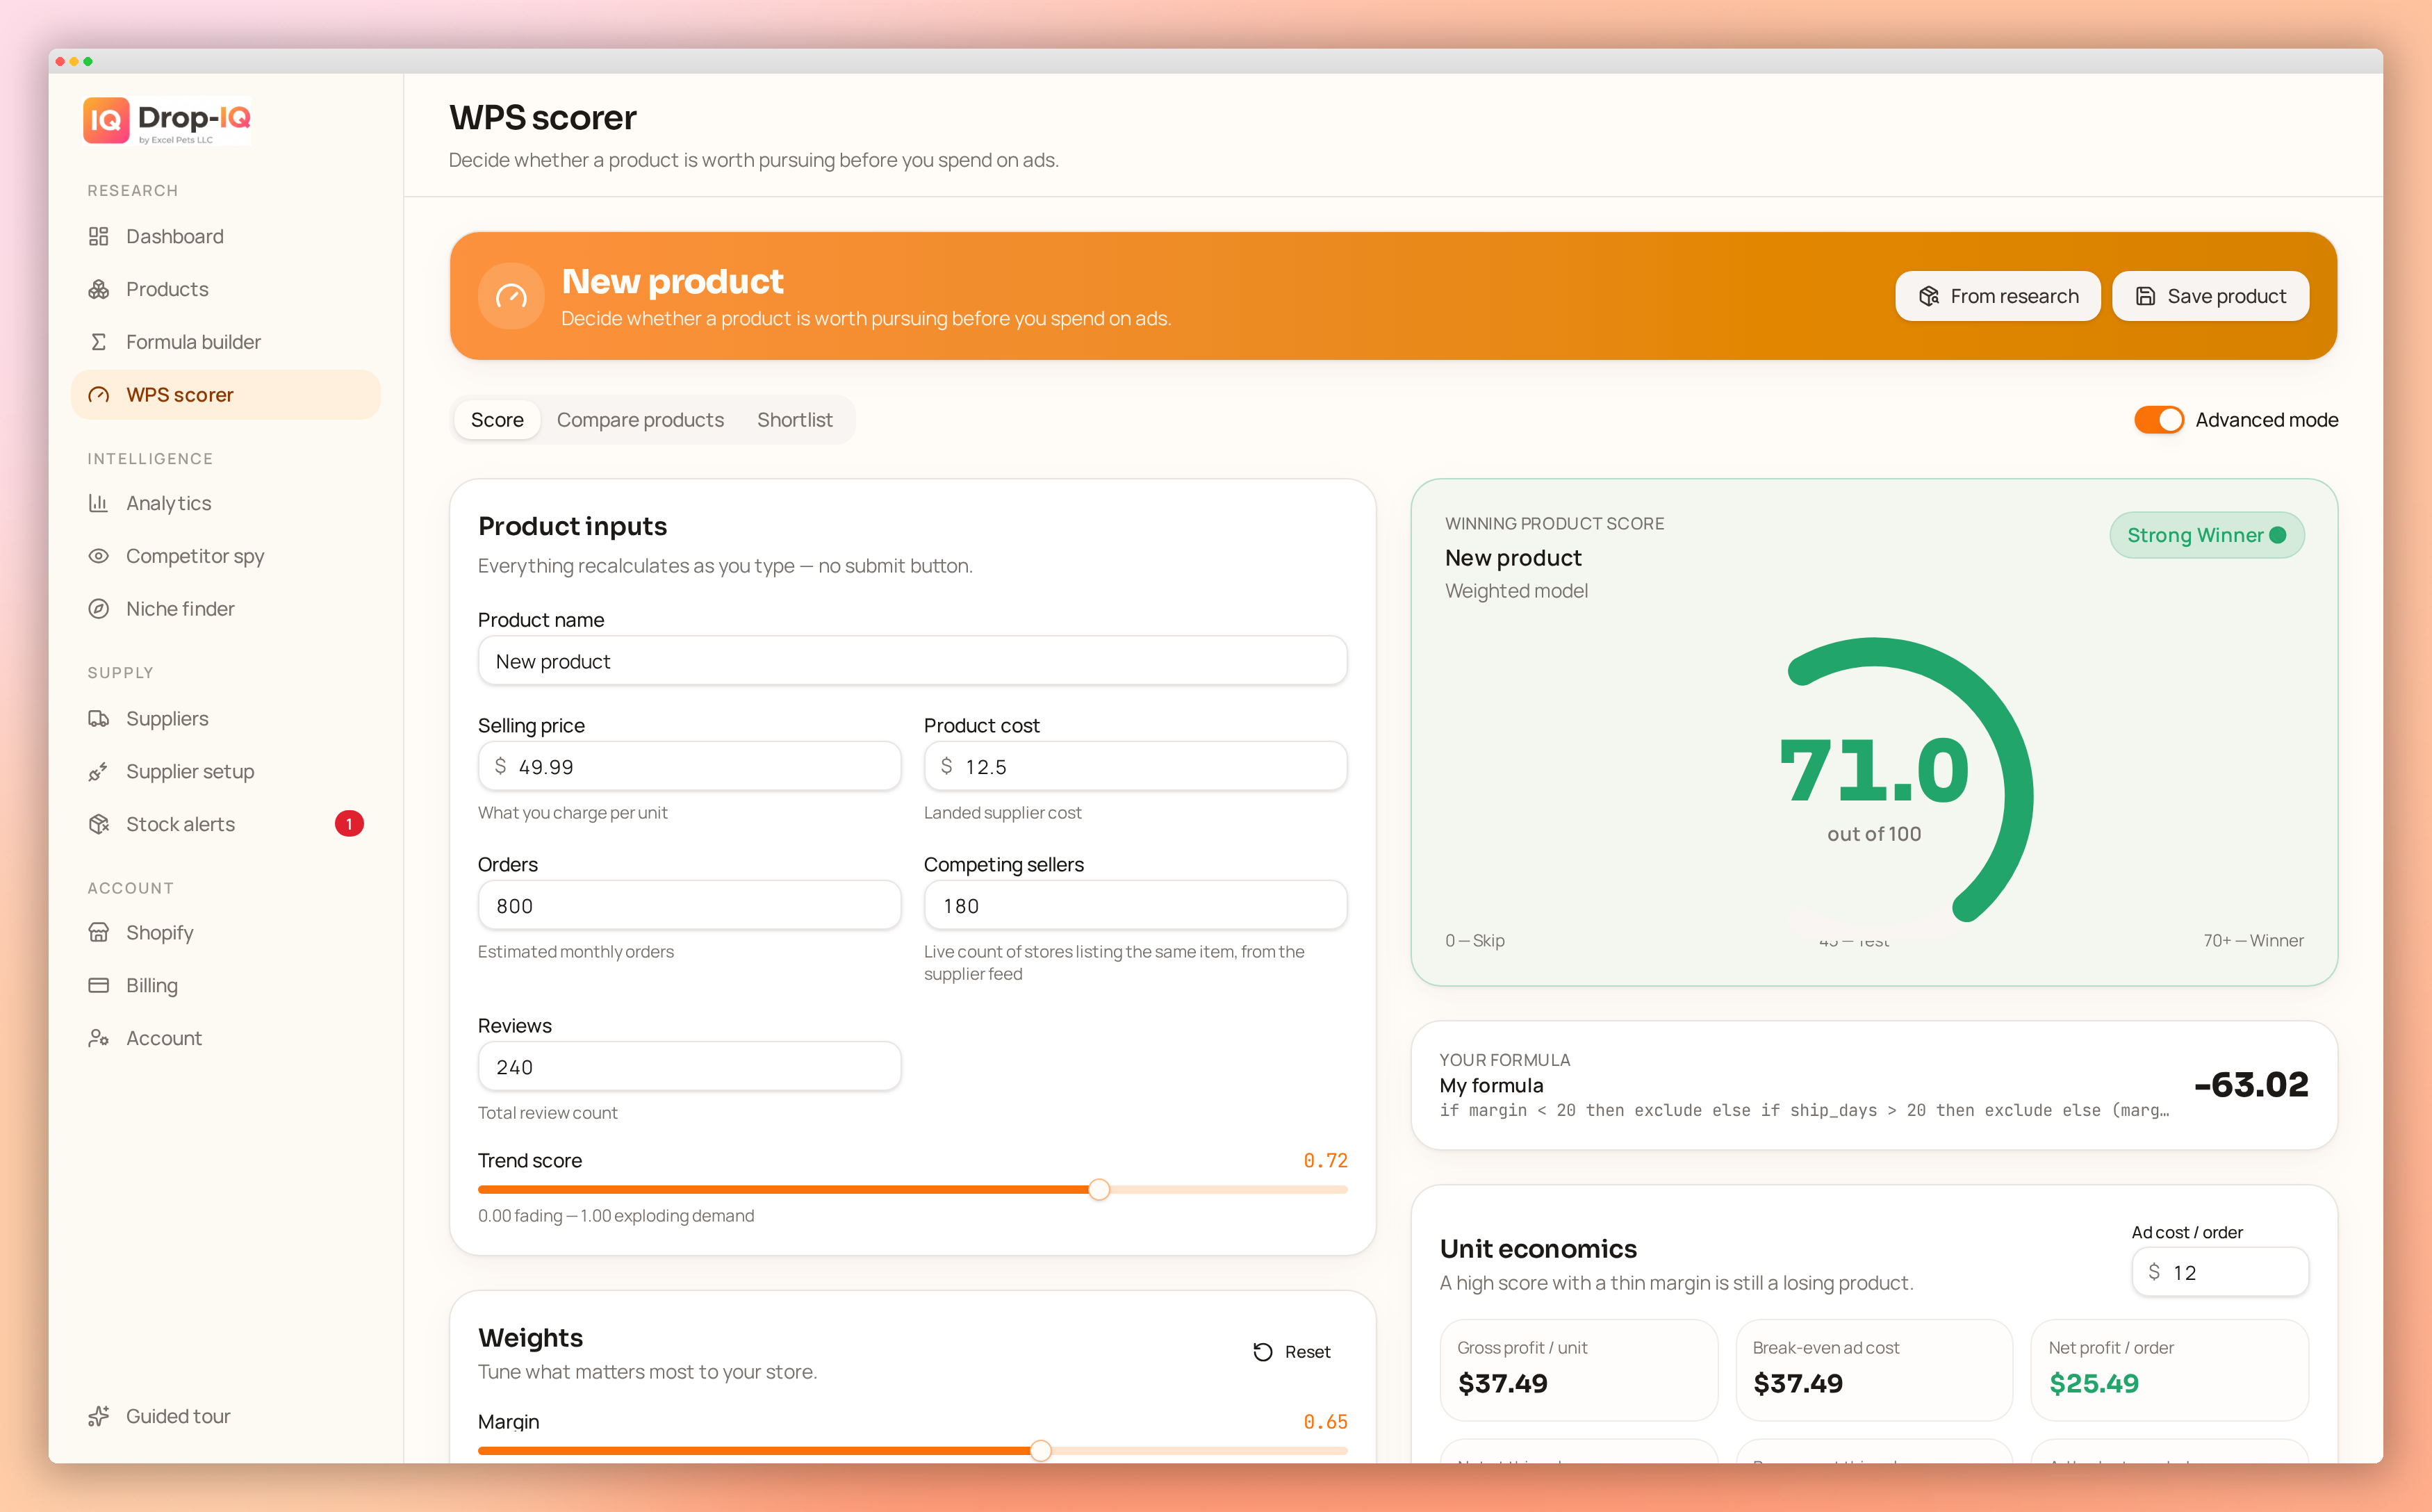
A listing can show an attractive product price and a respectable ROAS while still leaving very little money after fulfillment. The usual problem is sequencing: sellers compare ad performance first, then check whether the underlying order can support that ad cost.
Reverse the order. Calculate contribution margin for the customer’s destination, including an allowance for returns, and only then compare ROAS across listings.
Start with one destination and one selling price
Supplier economics change by destination. A listing with a low unit cost may become the expensive option once shipping to the United States, Canada or the United Kingdom is included.
Create a separate worksheet for each important destination. Use the same assumed selling price when comparing suppliers for the same product.
Your basic per-order formula is:
Contribution margin = selling price - product cost - destination shipping - payment fees - expected returns allowance - ad cost
Also calculate the contribution margin percentage:
Contribution margin % = contribution margin / selling price × 100
This is not the same as gross margin. Gross margin often includes only product cost, or product cost plus shipping. Contribution margin includes the variable costs required to acquire and fulfill an order.
Build the worksheet line by line
Use these inputs for every supplier listing.
| Worksheet line | What to enter | |---|---| | Selling price | The price paid by the customer, excluding pass-through taxes | | Product cost | Current supplier price for the selected variant | | Destination shipping | Shipping charge for the customer’s country and chosen method | | Payment fees | Percentage fee plus any fixed transaction fee | | Expected returns allowance | Expected financial loss from refunds, returns and failed deliveries | | Ad cost | Expected advertising cost per acquired order | | Contribution margin | Amount remaining after the costs above | | Contribution margin % | Remaining amount as a percentage of selling price |
Use current listing data rather than a supplier’s “from” price. The cheapest displayed variant or shipping route may not match the version you plan to sell.
If you absorb duties, packaging charges, currency-conversion fees or platform transaction fees, add separate lines for them. Avoid hiding known variable costs inside a general contingency percentage.
Calculate payment fees correctly
Payment fees usually have percentage and fixed components. If the selling price is $54, the fee is 2.9% and the fixed charge is $0.30:
Payment fee = ($54 × 2.9%) + $0.30 = $1.87
Use the actual fee structure for the payment methods and Shopify plan relevant to your store. If multiple methods are common, use a weighted average or run separate scenarios.
Check how refunded transactions are handled. Some providers do not return every part of the original processing fee. That nonrecoverable amount belongs in the returns allowance rather than being ignored.
Turn returns into a per-order allowance
Returns are uncertain, but excluding them assumes they cost nothing. A practical approach is to estimate an expected loss:
Expected returns allowance = expected return rate × average loss per return
The loss per return may include:
- Refunded revenue
- Nonrefundable processing fees
- Return shipping paid by the seller
- Product cost when the item cannot be recovered
- Original shipping that is not refunded
- Supplier dispute or reshipment costs
- Recovered inventory value, entered as a reduction
Be careful not to double-count costs. If your average loss-per-return estimate already includes every cost of the original order, adjust the main worksheet accordingly. A simpler method is to estimate how much worse a returned order is than a normal completed order and use that incremental loss.
For example, with a 6% expected return or refund rate and an average incremental loss of $32:
Returns allowance = 6% × $32 = $1.92 per order
Treat the return rate as an assumption, not a supplier fact unless you have reliable order history. Run a base case and a higher-return case when evaluating unfamiliar products.
Convert ROAS into ad cost per order
ROAS is revenue divided by ad spend. For contribution-margin calculations, convert it into an expected acquisition cost:
Ad cost per order = selling price / ROAS
At a $54 selling price:
- 3.0 ROAS implies an $18 ad cost
- 2.7 ROAS implies a $20 ad cost
- 2.0 ROAS implies a $27 ad cost
This conversion makes ROAS comparable with product, shipping and fee data. It also shows why ROAS cannot be judged independently of margin: the same 2.7 ROAS can be acceptable for one supplier listing and unworkable for another.
Worked comparison: two supplier listings
Assume both listings support a $54 selling price and are being evaluated for the same destination. Use a 2.7 ROAS, so expected ad cost is $20 per order.
| Per-order item | Listing A | Listing B | |---|---:|---:| | Selling price | $54.00 | $54.00 | | Product cost | -$16.00 | -$18.00 | | Destination shipping | -$7.50 | -$4.00 | | Payment fee | -$1.87 | -$1.87 | | Expected returns allowance | -$1.92 | -$1.12 | | Ad cost at 2.7 ROAS | -$20.00 | -$20.00 | | Contribution margin | $6.71 | $9.01 | | Contribution margin % | 12.4% | 16.7% |
Listing A has the lower product price, but it is not the lower-cost option after destination shipping and expected returns are included. Listing B leaves $2.30 more contribution per order under these assumptions.
That does not automatically make Listing B preferable. Stock, shipping time, variant availability and supplier reliability still matter. It does mean Listing A’s lower unit price should not determine the decision.
Find the break-even ROAS for each listing
First calculate contribution before advertising.
- Listing A: $54 − $16 − $7.50 − $1.87 − $1.92 = $26.71
- Listing B: $54 − $18 − $4 − $1.87 − $1.12 = $29.01
Then calculate break-even ROAS:
Break-even ROAS = selling price / contribution before advertising
The results are:
- Listing A: $54 ÷ $26.71 = 2.02
- Listing B: $54 ÷ $29.01 = 1.86
Below those ROAS levels, the scenario produces negative contribution under the stated assumptions. Break-even is not a target because it leaves nothing for fixed operating costs or profit, but it is a useful boundary.
Use margin in your product-ranking formula
Once each listing has comparable cost inputs, contribution margin can become part of a broader ranking formula rather than a final manual check.
For example:
score = (contribution_margin_pct × 0.45) + (ROI × 0.25) + (trend_score × 0.20) + (stock_score × 0.10), reject if shipping_days > 10
The weights and rejection rule should reflect your store’s constraints. A seller prioritizing cash efficiency may weight ROI more heavily; another may reject listings with thin stock or slow delivery even when their calculated margin is higher.
Before adding margin to a ranking formula, verify the individual scenarios with the Drop-IQ profit calculator. The honest next step is to run two supplier listings for one real destination, including a conservative returns allowance, and see whether your current ROAS target still leaves an acceptable contribution margin.